Background

Before delving into the problem, here’s a bit of background about the company. Vim’s mission is to lower healthcare costs for patients in the U.S.

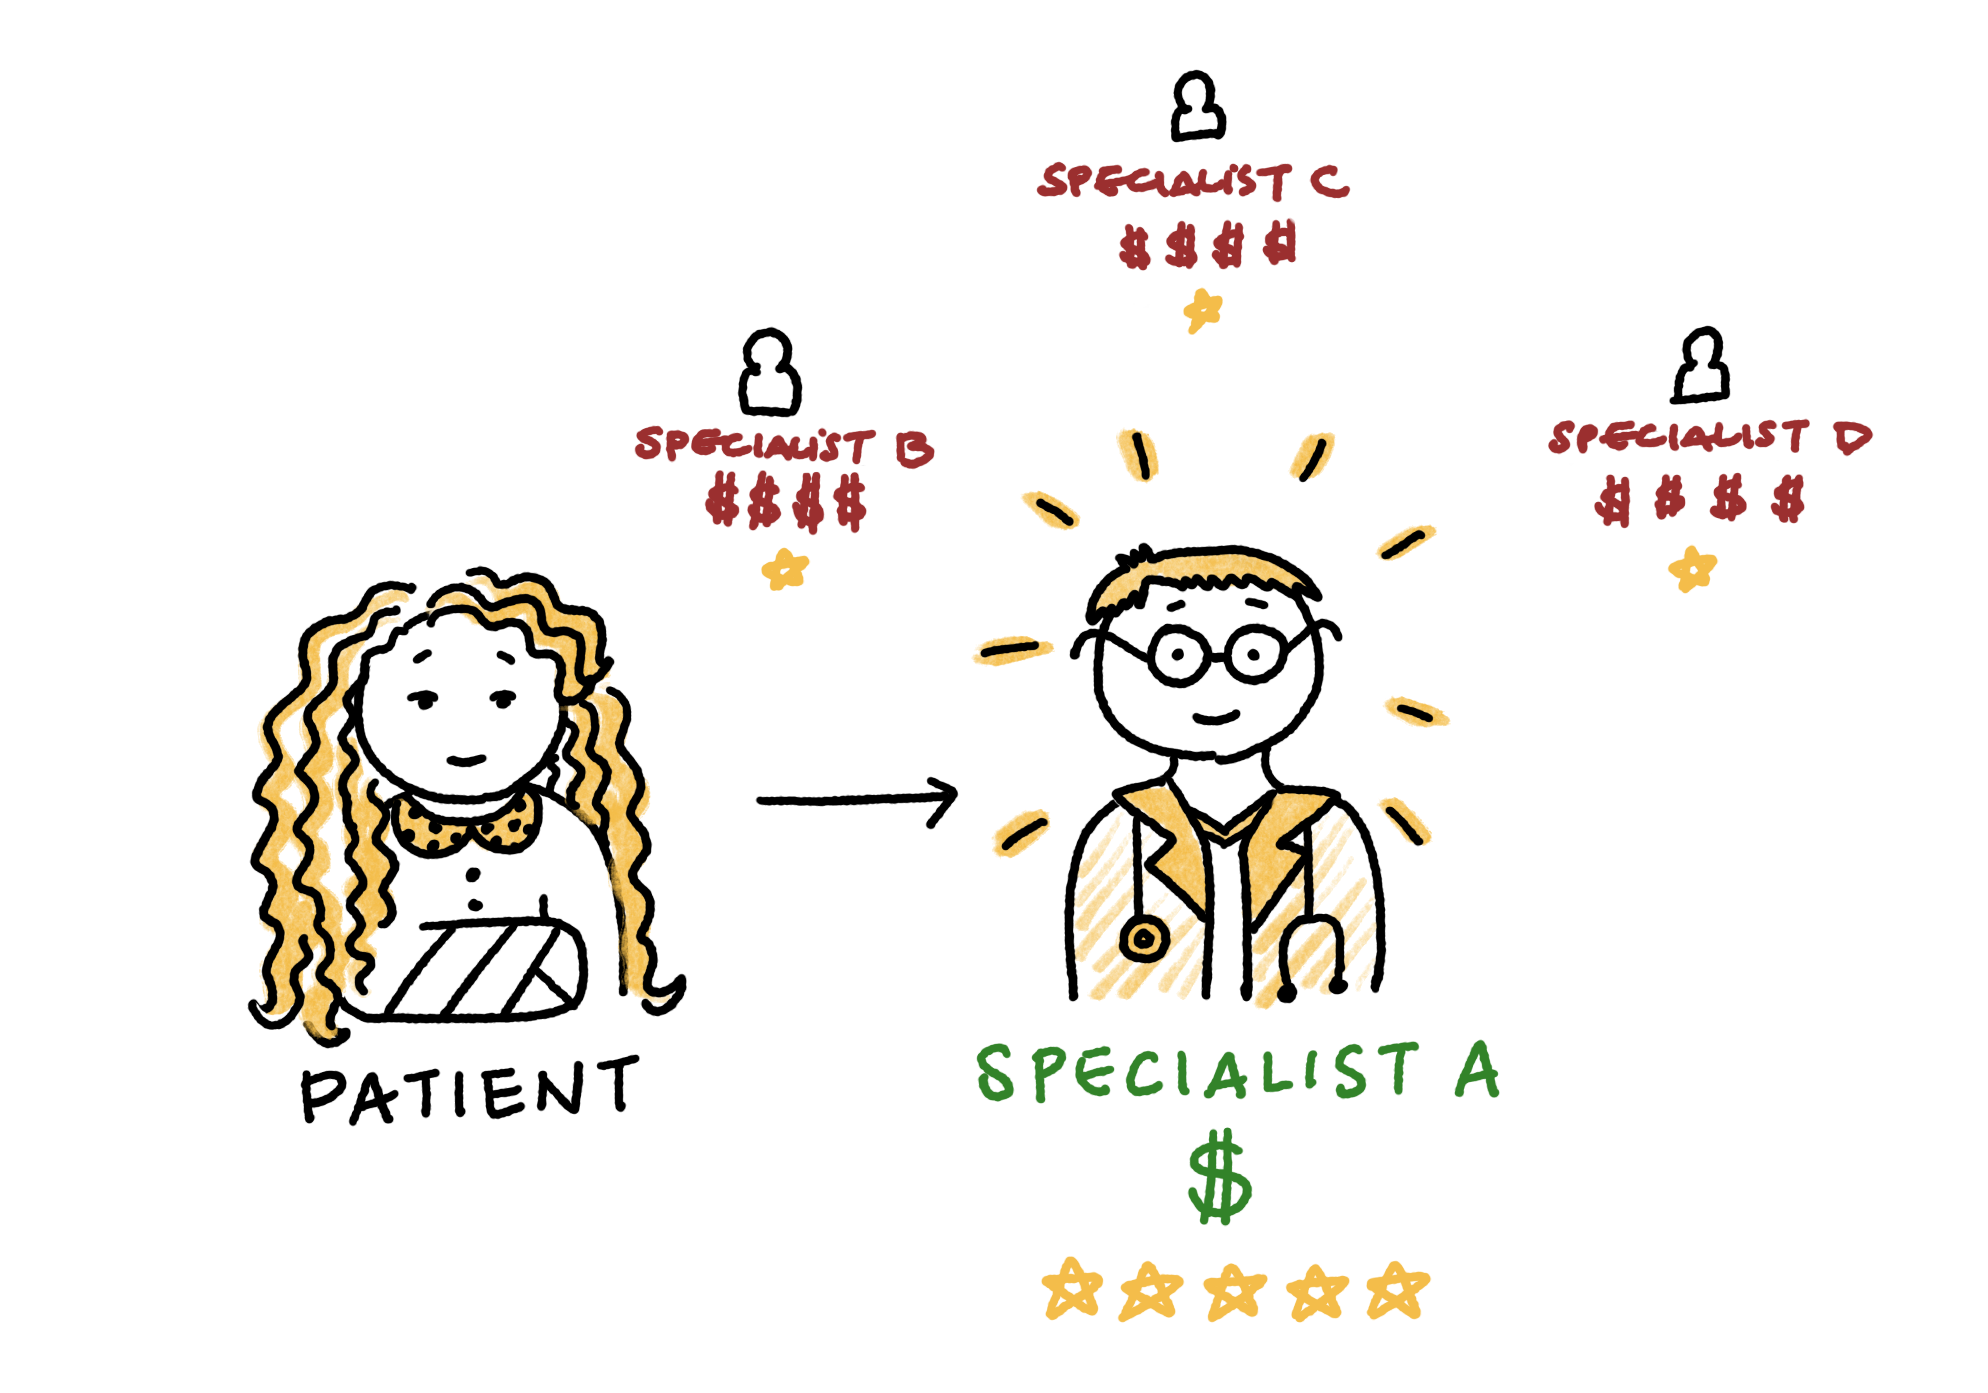
Our strategy is to create solutions that steer patients to specialists who provide high-quality care at an affordable cost.

What service did we provide?

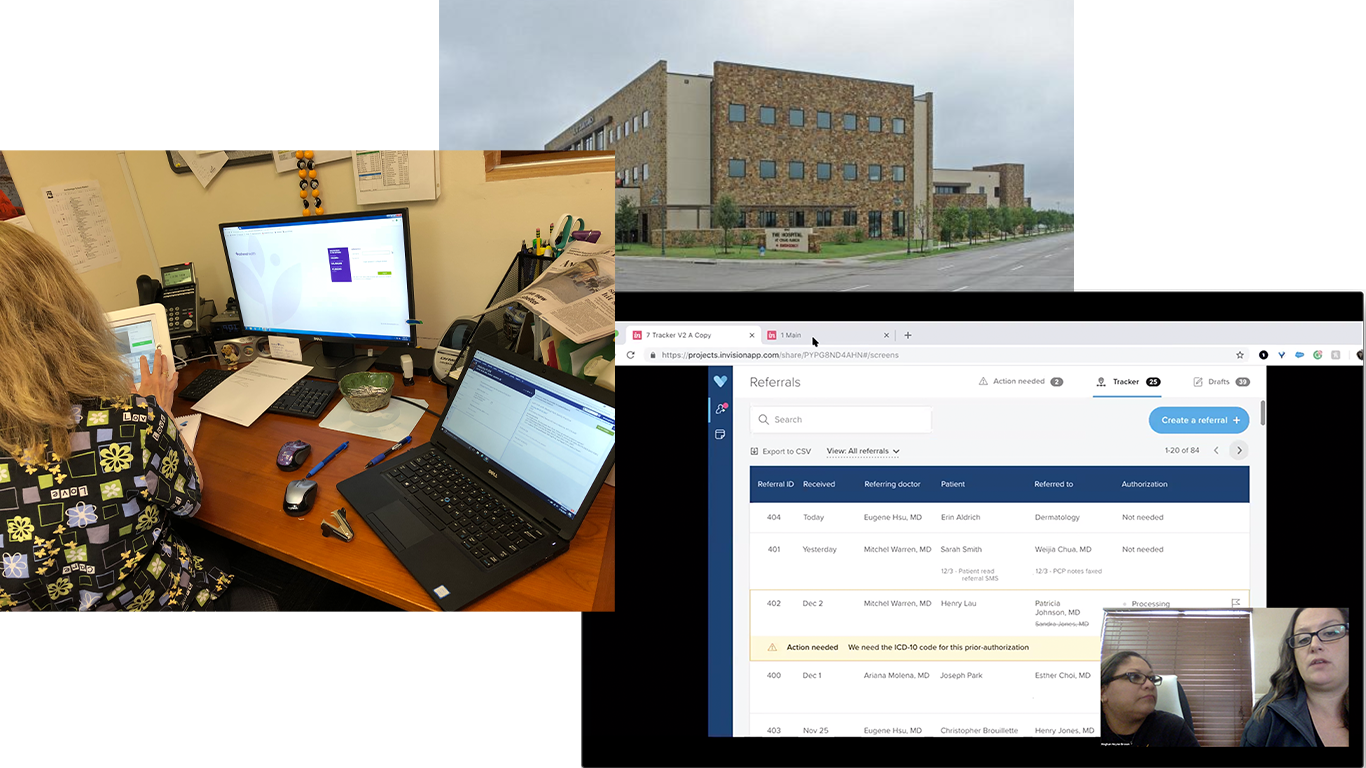
From our user research, we discovered that a prominent pain point across all types of provider clinics was that clinical staff didn’t like spending time following up with patients on their referrals.

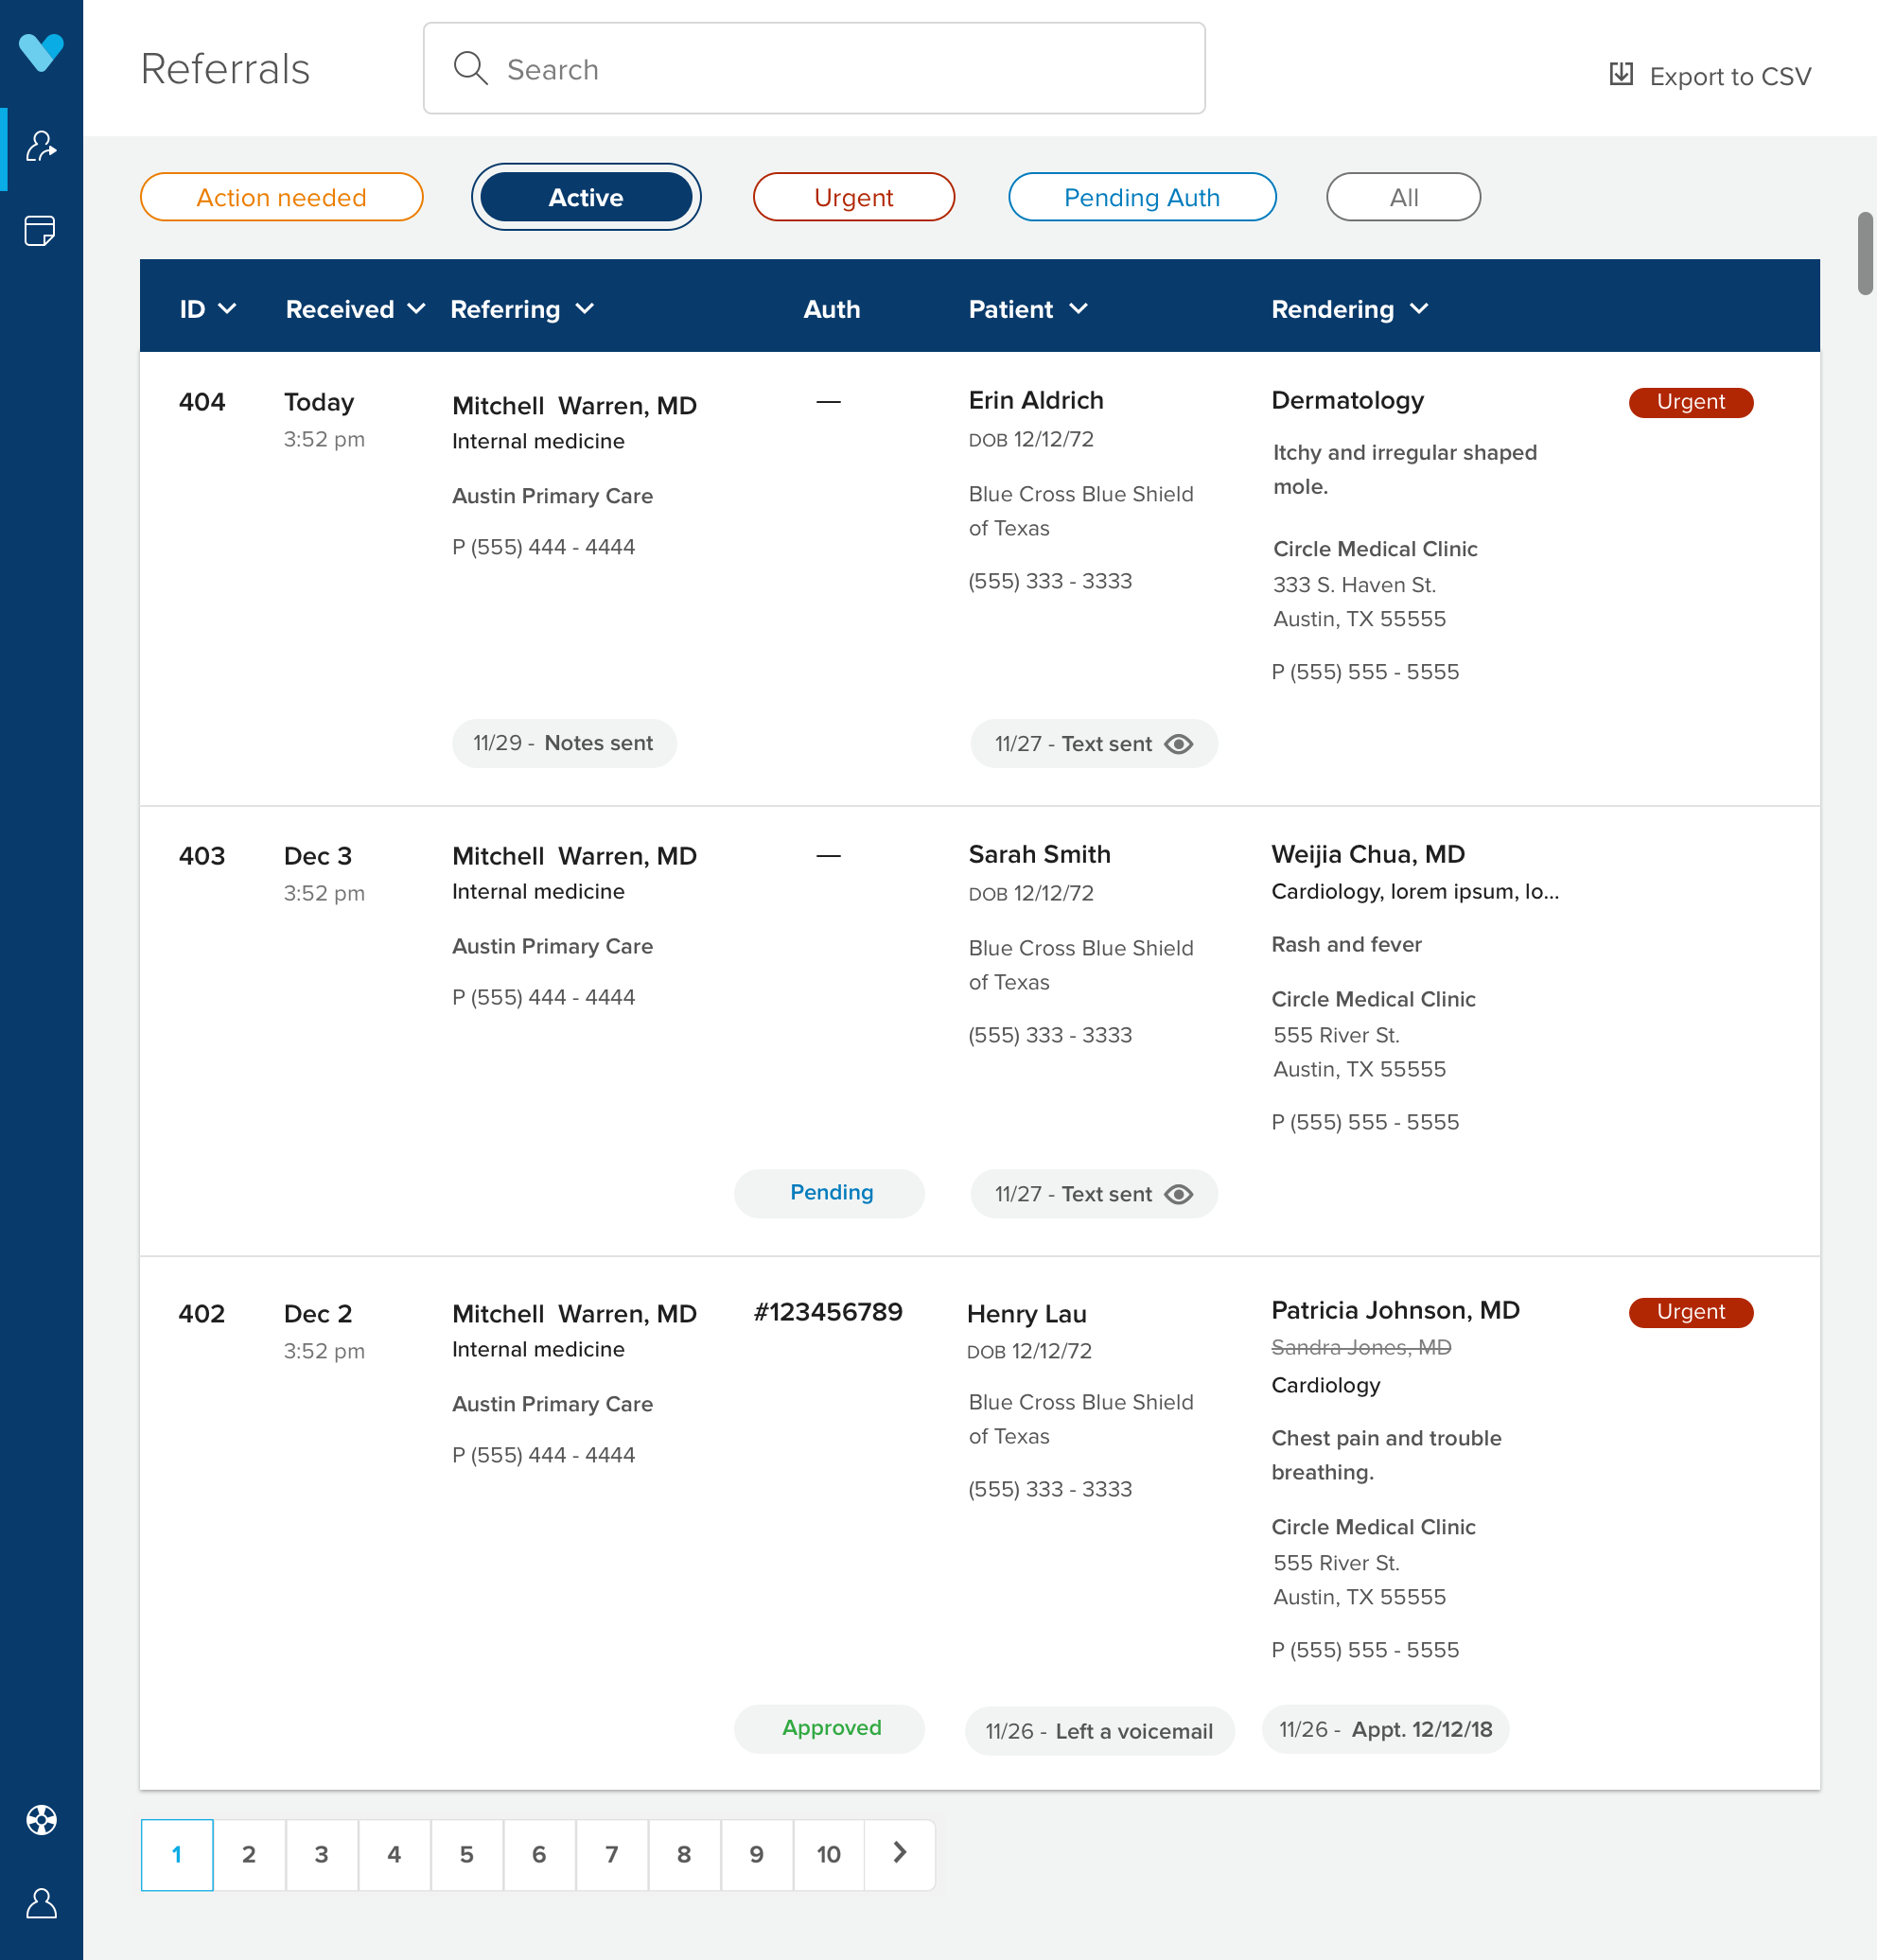
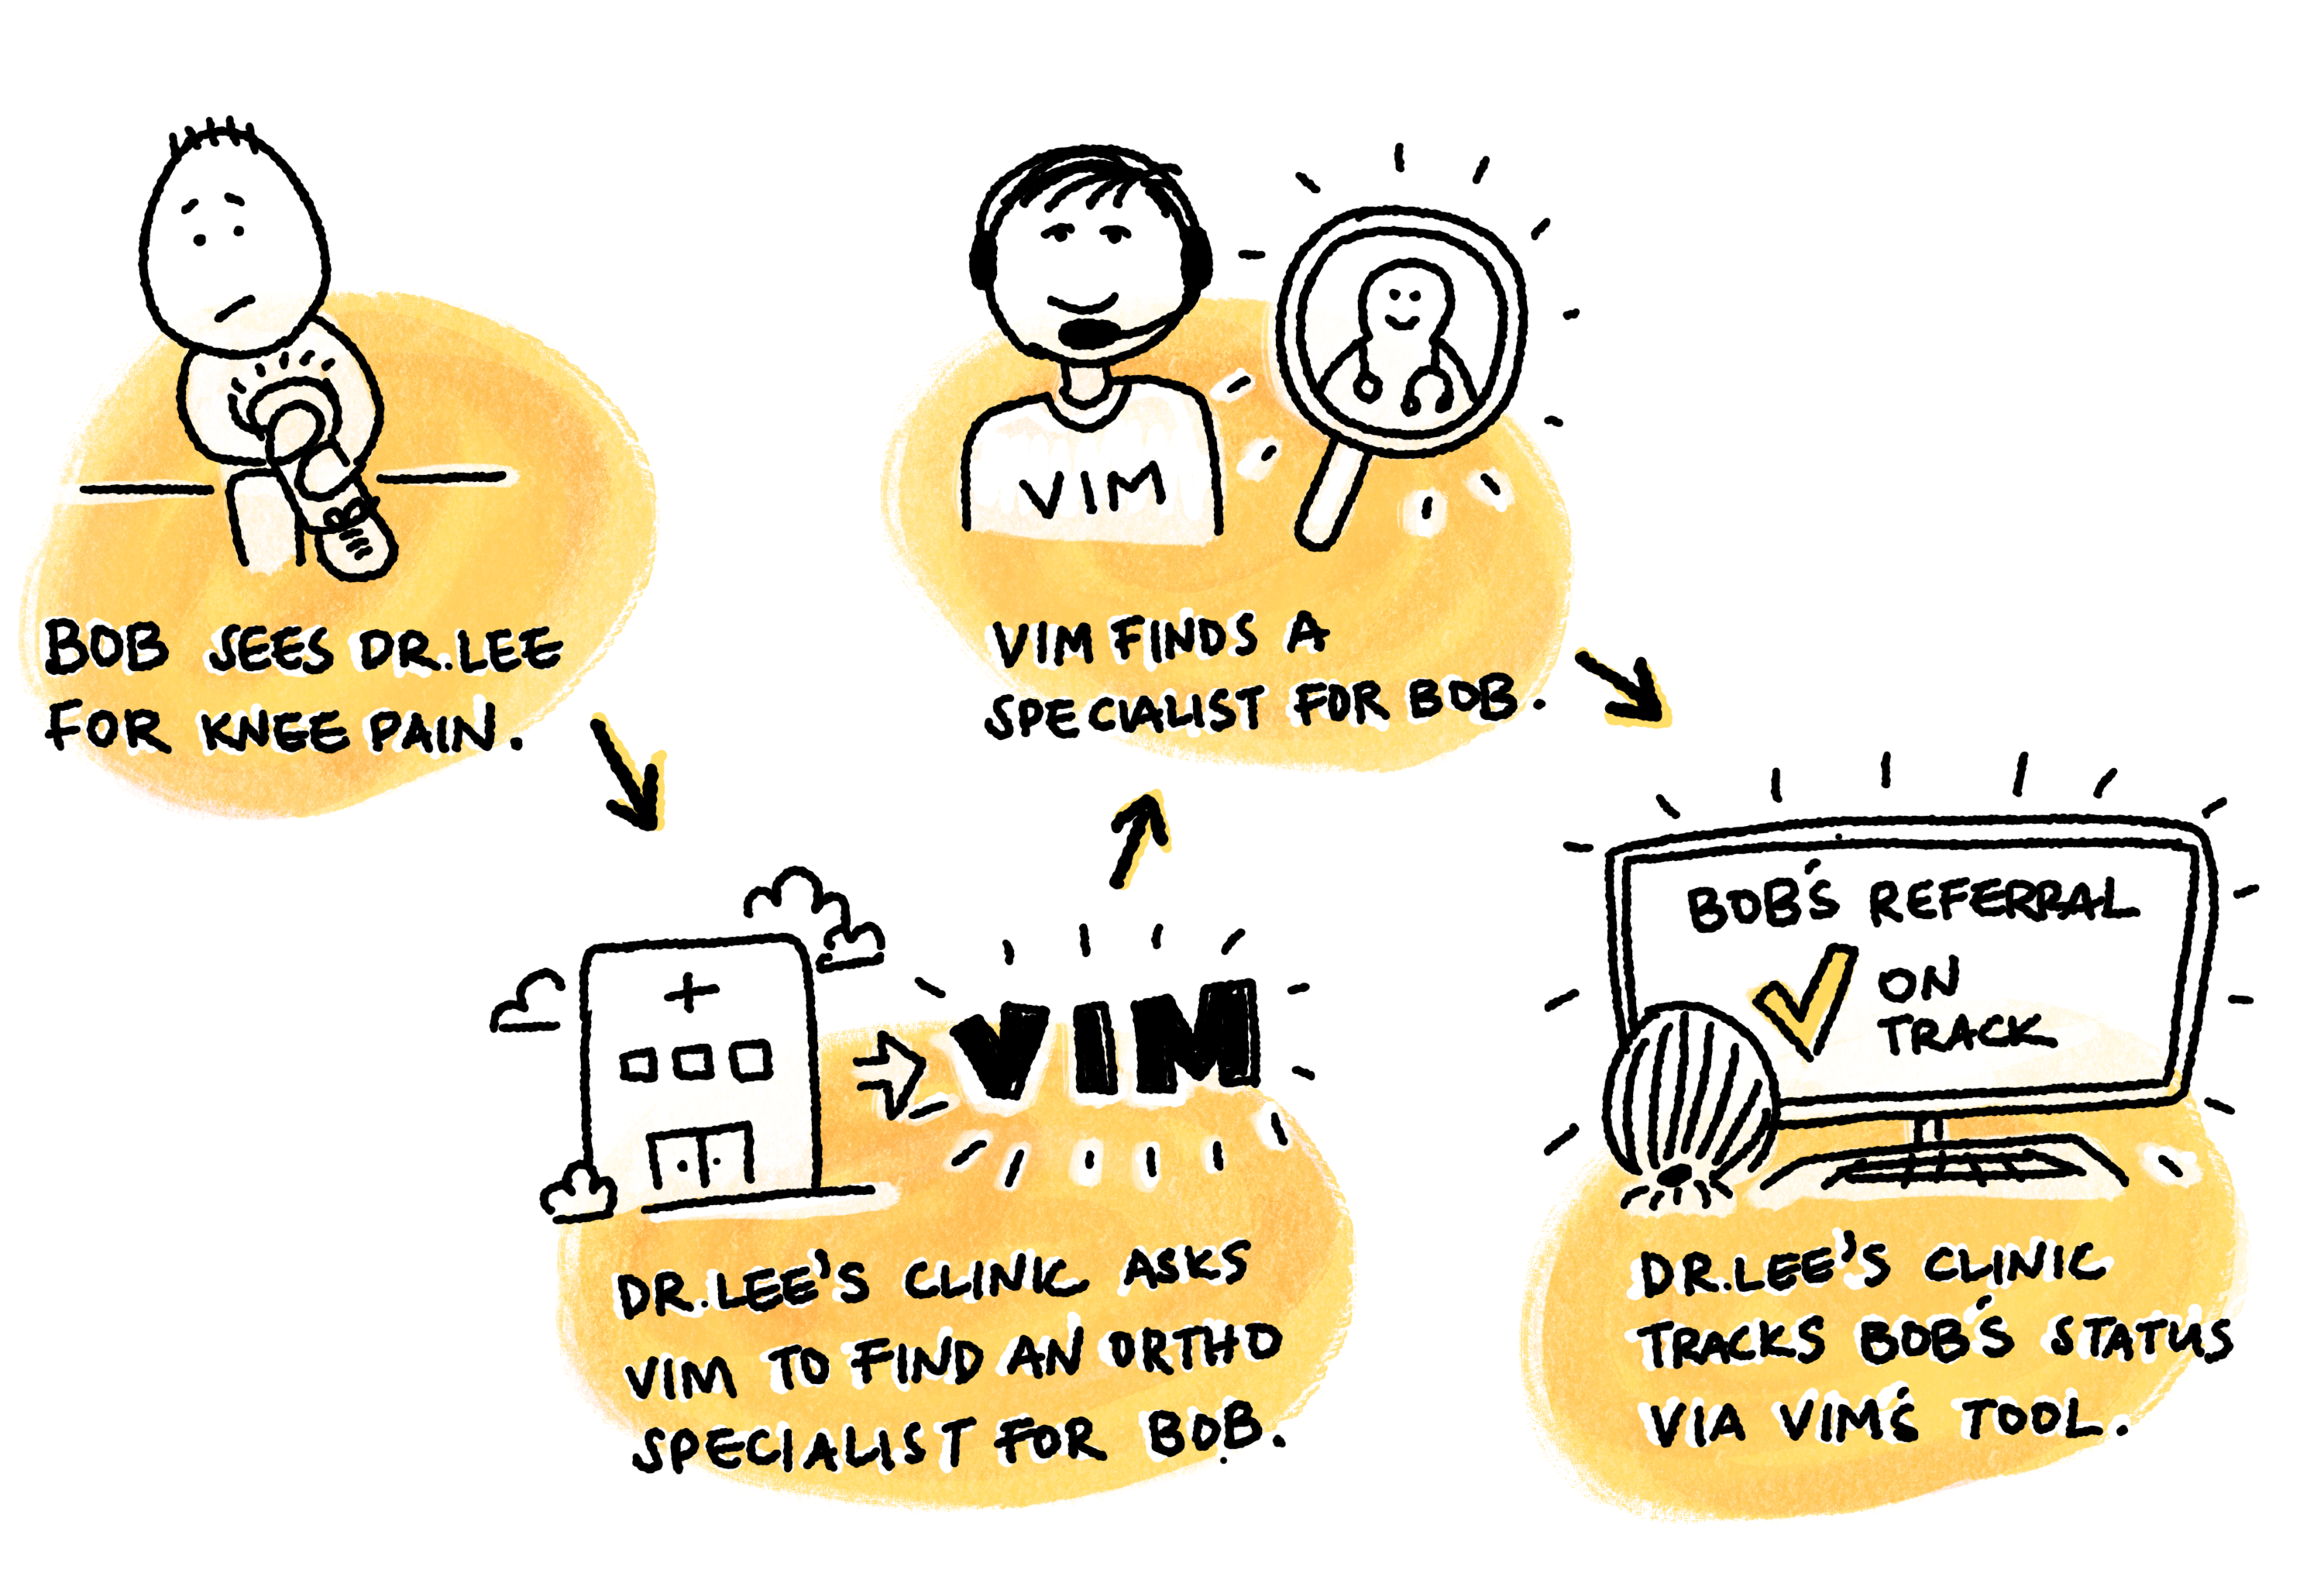
As a solution, Vim launched a referral coordination service to a pilot group of 10 clinics in Dallas and Alaska. When a patient is referred to a specialist, Vim finds the specialist on behalf of the clinic. The goal is for Vim to handle the referral process and give nurses more time to spend with patients.

Challenge

Soon after our initial launch of our referral service product with a pilot group of clinics, we saw a steady fall in service utilization over the next 3 months.

We were falling short of our goal to receive and process at least 70% of a clinic’s total monthly referrals. We knew that our current solution wasn’t solving the user’s problem, so we went back to the drawing board.

Digging Deeper

We wanted to understand why service utilization was down, so we visited 3 of our largest clinics. We interviewed 5 users to understand how they feel about Vim’s services. We also conducted usability tests on the current tracking tool.

We clustered similar pain points and insights together and ranked each of those categories by how common of an issue it was across all the users.

Top User Problems

Prioritization matrix

We brainstormed potential solutions for our top pain points. We plotted our ideas on a prioritization matrix based on user impact and feasibility.

From the matrix, we focused on the highest impact/easiest to implement solutions. The following are the two main insights linked to those MVP solutions.

Insight #1

Users had a hard time finding relevant information on the tracking tool to answer a patient’s phone call.

Insight #2

Users felt uneasy when they saw that the majority of their referrals visually appeared “incomplete” in the tracking tool.

Test Plan

We believe that by updating the tracker to show just the statuses coordinators care about and reduce noise, it will help them find the tracker more useful.

We’ll run usability tests to optimize the tracker, then launch the updates to 2 pilot clinics.We’ll know the hypothesis is valid if we see that clinics on average are referring at least 70% of their total referrals for the first three months.

Initial Sketch

Once user stories were created from the hypothesis, I started sketching ideas and creating prototypes to test.

Final Design

Solution for insight #1

Users had a hard time finding relevant information on the tracking tool to answer a patient’s phone call.

Solution for insight #2

Users felt uneasy when they saw that the majority of their referrals visually appeared “incomplete” in the tracking tool.

Results

After testing the prototypes, 5 out of 5 users confirmed that the updated information was more helpful for fielding referral related phone calls. By month 3 after relaunching the product, clinics were referring an average of 73% of their total referrals.